(1D) Ordered Tokens Enable Efficient Test-Time Search


1Swiss Federal Institute of Technology Lausanne (EPFL)     2Apple
Equal technical advising
ICML 2026
SoTo teaser: 1D ordered tokens enable effective test-time search.

(a) Comparison of intermediate readouts. 1D ordered tokens provide a coarse-to-fine structure with an interpretable readout. This makes it easier for verifiers to guide generation toward the desired output than with 2D grid tokens generated in raster-scan order. (b) Scaling behavior. This advantage enables 1D ordered tokens (in this plot, FlexTok) to scale better at test time than 2D grid tokens in controlled experiments (see here for more details).

Summary

TL;DR
... ... ... ...
Detailed
TL;DR
Detailed

(1D) Ordered Tokens

Background: From 2D Grid Tokens to 1D Ordered Tokens

A tokenizer represents an image as a set of discrete tokens. In practice, the goal is to achieve high-quality reconstruction while using a limited number of tokens. These tokens are typically later used in a generative model, such as an autoregressive model, for image generation.

The standard approach maps an image into a fixed grid of tokens (which we refer to as 2D grid tokens) (e.g., VQ-VAE, VQ-GAN). However, this method implicitly assumes that information is distributed uniformly across the spatial grid of the image. In reality, this assumption does not hold: different regions of an image may require very different representational capacities (e.g., a large sky region versus a dense crowd).

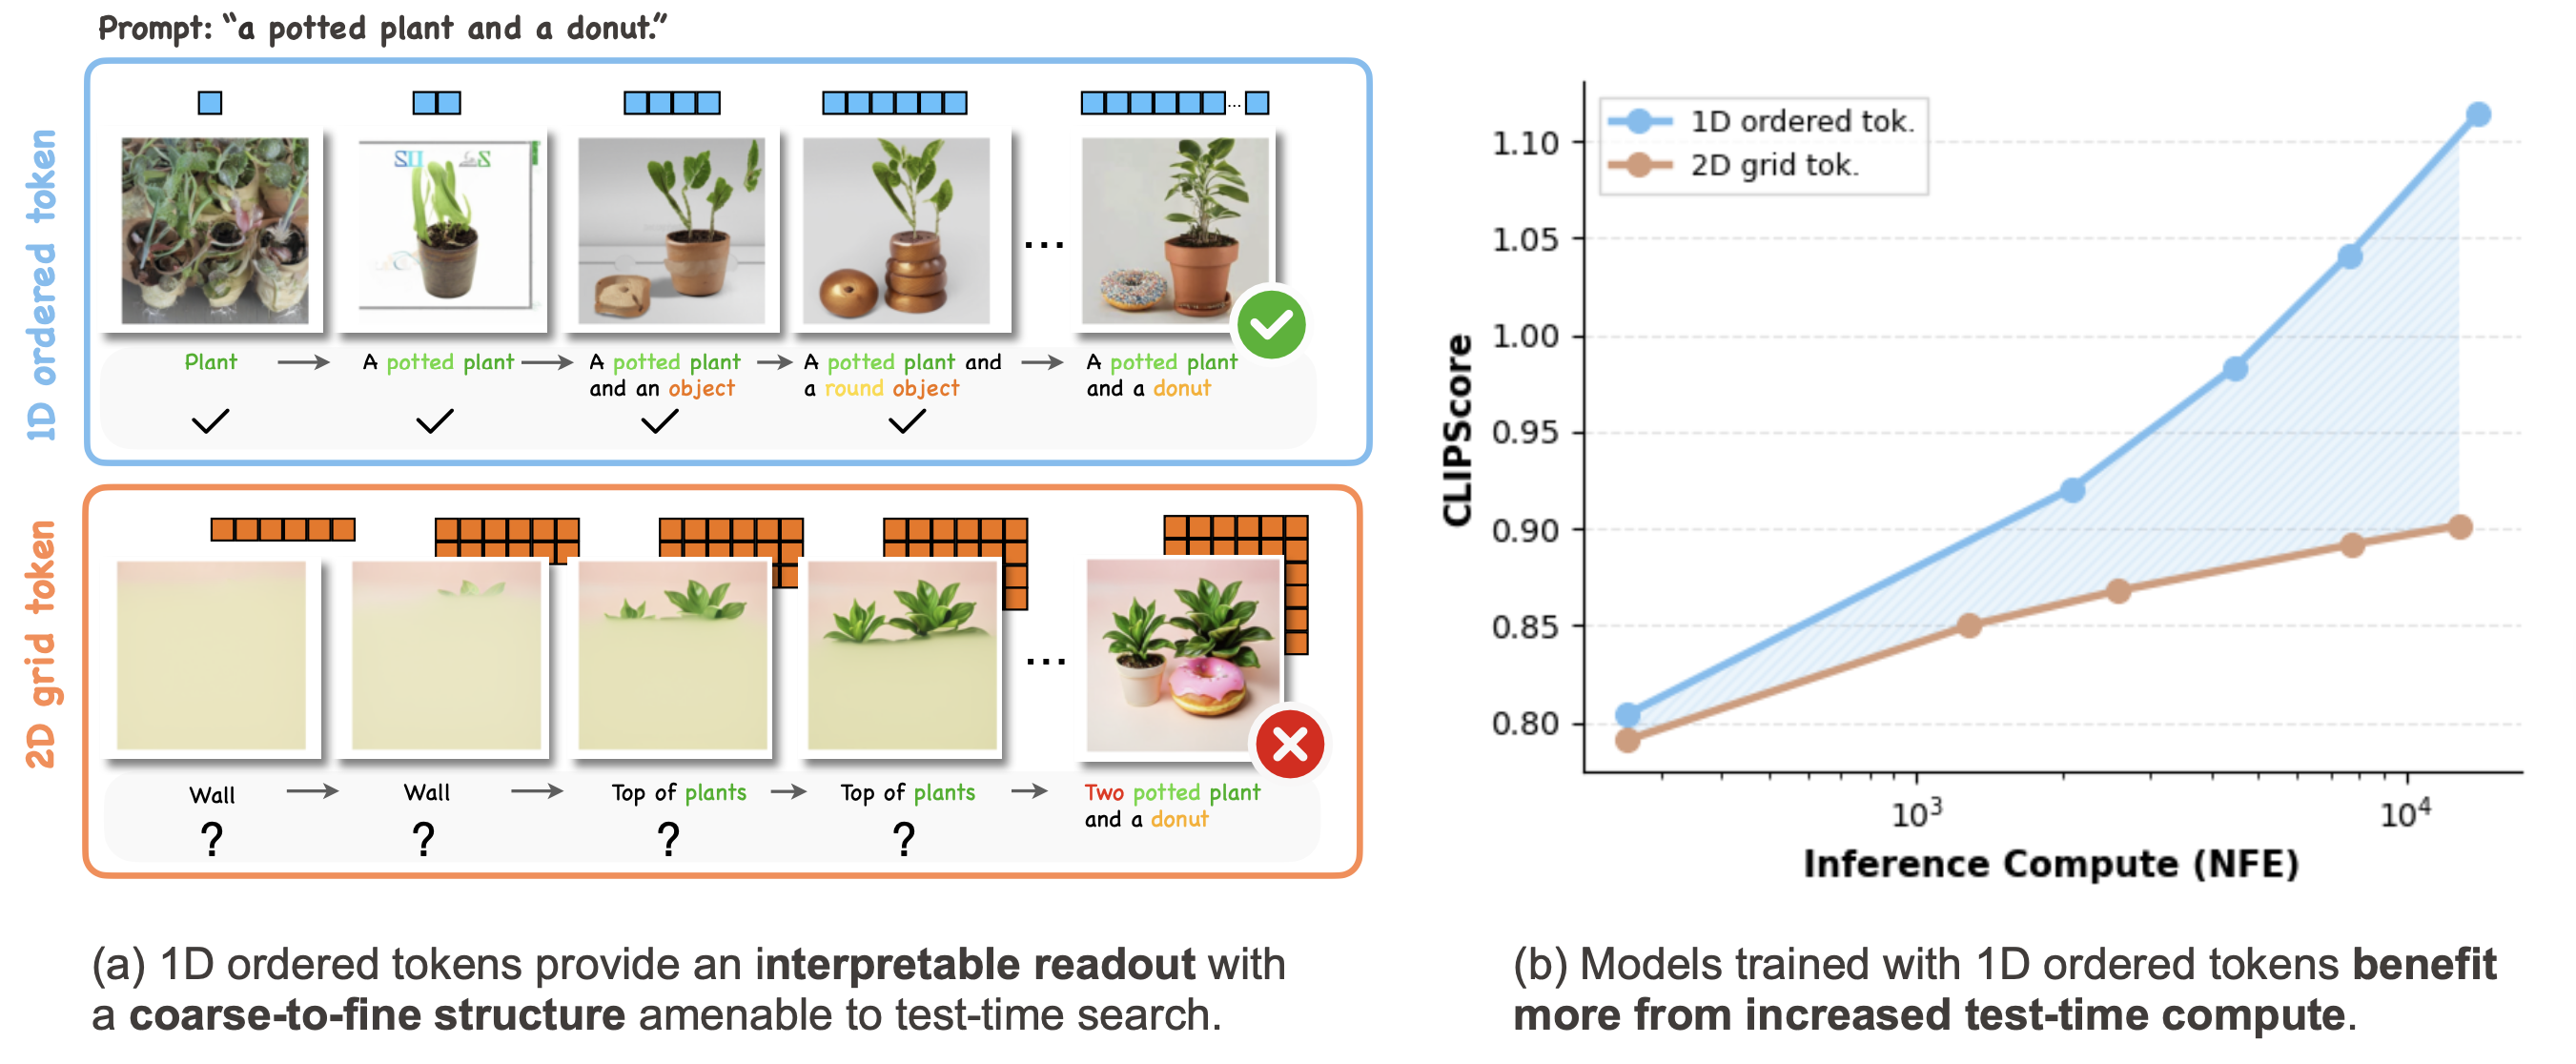
To address this limitation, 1D tokenizers (e.g., TiTok) represent an image as a 1D sequence of tokens, removing the rigid spatial grid constraint. Subsequent works such as FlexTok and Semanticist further introduce structured token sequences, where images are represented with flexible-length tokens and a coarse-to-fine ordering (e.g., via nested dropout). We refer to this family of representations as 1D ordered tokens, which is the primary focus of this work.

In this paper, we argue that the ordering of tokens plays an important role in the test-time scaling (TTS) performance of autoregressive models trained on top of such token structures. In the remainder of this section, we illustrate how the token structure provides a useful representation for search.

1D tokenization
Seed 1

Tokenization with a 1D ordered tokenizer (here, FlexTok). Hover over the figure, use ▶, or drag the slider to view different seeds.

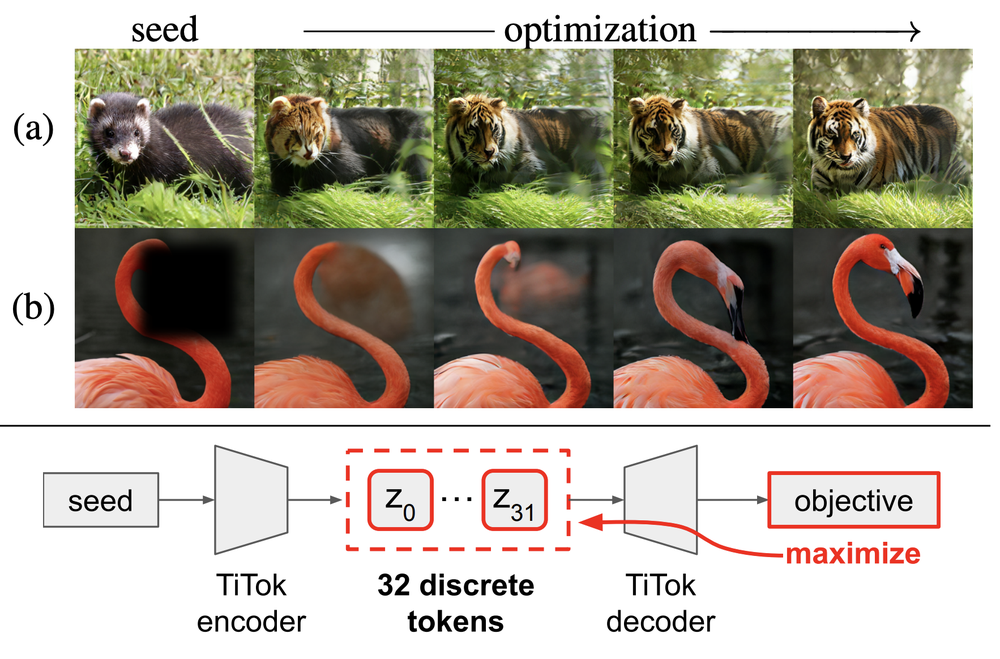
In the figure above, we show an example of the tokenization and detokenization process using FlexTok, a representative 1D ordered tokenizer. An image is first tokenized into a sequence of tokens and can later be detokenized into images using different token lengths. As the number of tokens increases, the reconstructed images reveal a coarse-to-fine progression of information, where early tokens capture global structure while later tokens refine finer details.

In addition, by changing the random seed of the flow-based detokenizer, different decoded images can be generated from the same token sequence. Although these images vary in appearance, they share consistent semantic characteristics. Observing these similarities reveals that individual tokens capture underlying concepts or distributions within the image representation.

Visual Vocabulary of the First Token

Below, we visualize images detokenized from the first token in FlexTok to understand the visual vocabulary it captures. As shown, each token tends to correspond to certain semantic concepts (illustrated by the nine detokenized images generated with different seeds). Browsing across tokens reveals that the first-token space covers a broad range of semantic categories. For example, if one wishes to find a token representing a concept such as "shoes," it is often possible to identify one by searching through images decoded from individual tokens.

Hover or tap a point
to see the decoded image

t-SNE visualization of FlexTok's visual vocabulary. Each of the 6,400 points represents a unique FlexTok token, randomly sampled from the 64K-token vocabulary. The embedding is computed from CLIP image features and colored according to K-means clusters. Hover over (or tap) a point to see nine images decoded from that token with different seeds. Drag to pan, scroll (or pinch) to zoom into a region of interest.

However, generating more structured scenes, such as "a group of sheep standing in the grass," is more difficult and may require multiple tokens to capture the necessary semantic and compositional information. This observation suggests that the token space can be viewed as a tree-structured search space, where tokens progressively refine the generated image.

Generation by Search

The broad visual vocabulary captured by the first token, together with the coarse-to-fine nature of the token sequence, naturally raises the question: can the token space be viewed as a tree structure, where tokens progressively refine an image? If so, it becomes possible to perform tree search over tokens to find images that best satisfy a given criterion. The figure below shows this concept.

Beam search
Step 3

Tree search over ordered token structures, guided by an image-text similarity score (verifier), enables text-to-image generation without training an autoregressive model. Hover over the figure, use ▶, or drag the slider to explore each search step.

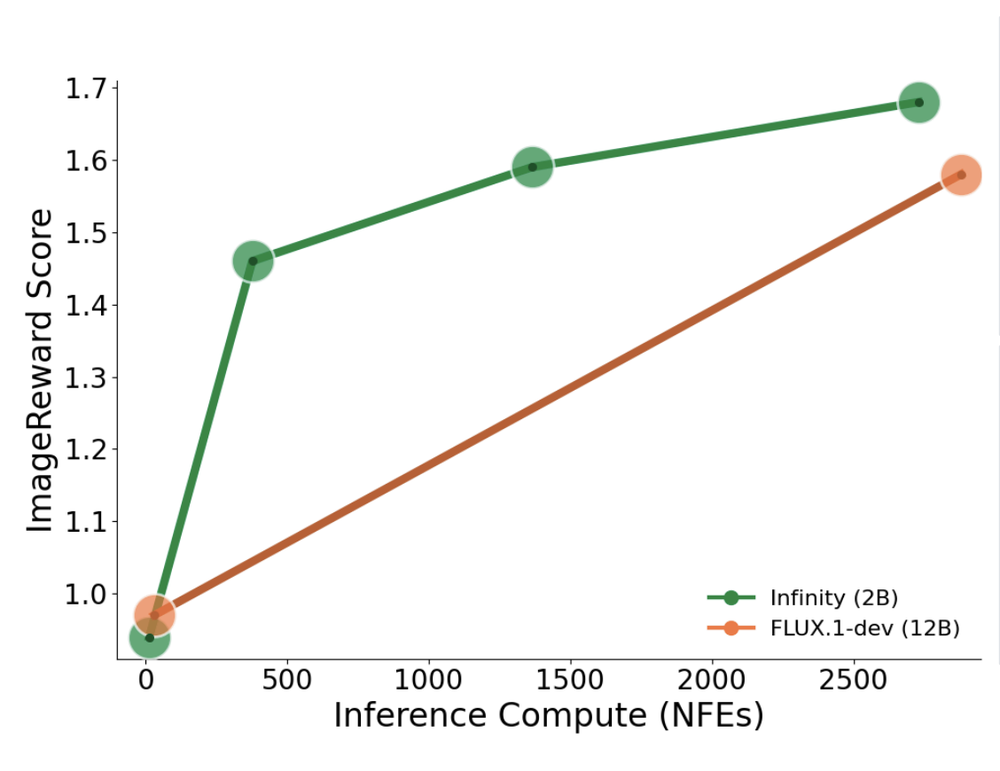
To examine this intuition, we perform beam search over FlexTok tokens (beam size = 5). At each step, we randomly sample 1% of the 64K token vocabulary as candidate tokens for each beam. Each candidate token sequence is detokenized into an image and scored against the text prompt, and the resulting scores are used to retain the top beams for the next search step. We use ImageReward as the scoring function, as it evaluates both image-text alignment and aesthetic quality of the generated images.

We test this approach on prompts from GenEval and COCO. Surprisingly, even without training an autoregressive model, the search procedure can produce reasonable images, including complex prompts involving multiple objects, colors, and spatial relationships. Three examples are shown below.

"a photo of a microwave"
Training-free generation result
Top-5 images selected in Step 1 (beams).
Search process
Step 1 / 24

Examples of direct search over 1D ordered tokens. Top: images at five key search steps. Bottom: top-5 beams at each step. Hover over the figure, use ▶, or drag the slider to scrub through the search steps. Jump to more examples.

We observe that early tokens often correspond to concepts that are semantically close but not exactly matching the prompt. As more tokens are added, the generated images become more aligned with the prompt and additional visual details gradually emerge. Quantitatively, this method achieves 79% accuracy on the GenEval single-object category. We refer readers to the section Impact of AR Prior Strengths for more visualizations and quantitative results.

SoTo Framework

The previous results suggest that 1D ordered tokens exhibit a strong coarse-to-fine structure, making them naturally amenable to search. This property is also closely related to the test-time scaling behavior of AR models. In this section, we describe how test-time search can be combined with AR models and identify the key factors involved.

AR models are typically trained to model token-sequence probabilities, either conditioned on text or unconditionally. This can be viewed as a prior distribution over token space, which helps constrain search and encourages exploration in more reliable regions.

To systematically study test-time scaling for a given token structure, we focus on three components: search algorithms, verifiers, and AR-prior strength. The figure below illustrates this framework (click each block to see details). We refer to this evaluation framework as Search-over-Tokens (SoTo) and open-source the codebase as an extensible platform for studying test-time scaling in autoregressive models.

Overview of the Search-over-Tokens (SoTo) evaluation framework. We use this framework to study test-time scaling under controlled swaps of: (A) Search algorithm (Best-of-N, Beam, Lookahead), (B) Verifier (alignment and quality scores), and (C) AR prior (conditional, unconditional, and uniform).

Results & Analysis

TTS across token structures

Controlled setup. To isolate the effect of token structure on test-time scaling, we conduct an apples-to-apples comparison between AR models trained on 1D ordered token sequences (FlexTok) and 2D grid tokens, following the controlled setup of FlexTok where data, architecture, and training compute are matched. We evaluate three inference-time search strategies, best-of-N sampling, beam search, and lookahead search, while varying N and the number of search steps to control test-time compute.

The figure below shows an example generation under different inference budgets for FlexTok and the 2D grid token variant, along with the corresponding quantitative scaling curves. Results are summarized on a 300-image subset of the COCO Karpathy validation set, using CLIP as the verifier.

Prompt: "A place setting with bowls of broccoli and cauliflower with utensils"
Hover over (or click) the ▶ button in each search column to replay its step-by-step animation.
AR baseline
Best-of-N
Beam search
Lookahead search
1D FlexTok
FlexTok AR baseline
N = 5
FlexTok best of N equals 5
N = 10
FlexTok best of N equals 10
N = 30
FlexTok best of N equals 30
N = 50
FlexTok best of N equals 50
16 steps
FlexTok beam search 16 steps
64 steps
FlexTok beam search 64 steps
128 steps
FlexTok beam search 128 steps
256 steps
FlexTok beam search 256 steps
4 steps
FlexTok lookahead search 4 steps
8 steps
FlexTok lookahead search 8 steps
16 steps
FlexTok lookahead search 16 steps
32 steps
FlexTok lookahead search 32 steps
2D Grid
2D grid AR baseline
N = 5
2D grid best of N equals 5
N = 10
2D grid best of N equals 10
N = 30
2D grid best of N equals 30
N = 50
2D grid best of N equals 50
16 steps
2D grid beam search 16 steps
64 steps
2D grid beam search 64 steps
128 steps
2D grid beam search 128 steps
256 steps
2D grid beam search 256 steps
4 steps
2D grid lookahead search 4 steps
8 steps
2D grid lookahead search 8 steps
16 steps
2D grid lookahead search 16 steps
32 steps
2D grid lookahead search 32 steps
View:

Hover for NFE and CLIPScore. Click a data point to keep its settings and visualizations visible.

Hover or click a data point to show the settings and visualizations for that experiment.

Test-time scaling across token structures. Use the view dropdown to compare each tokenizer under its best-performing search algorithm (FlexTok -> Beam, Grid -> Best-of-N). NFE denotes the number of function evaluations; the leftmost point corresponds to no search.

The curves show that both models achieve similar CLIP scores without search, indicating comparable base generation quality. As inference compute increases, both tokenizations exhibit similar scaling trends under best-of-N sampling and lookahead search. However, beam search behaves very differently: performance improves rapidly for 1D ordered tokens but only marginally for 2D grid tokens. When comparing each tokenizer with its best-performing search algorithm (switch to best per tokenizer view), 1D ordered tokens consistently achieve higher performance across inference budgets.

This behavior largely arises because 1D ordered tokens produce more interpretable intermediate outputs, enabling search to guide generation more effectively (see the generation process by hovering over points on the curve).

Scaling across model sizes

We examine the extent to which inference-time search can compensate for training-time compute. We evaluate FlexTok autoregressive models across a range of parameter sizes using best-of-N sampling, which provides a consistent way to control inference compute and trace scaling behavior across model sizes.

We observe that a 530M-parameter model with sufficient test-time compute can outperform a larger 3.4B-parameter model operating with limited inference compute. As inference compute increases, however, larger models exhibit stronger scaling behavior. Overall, performance traces a Pareto frontier with respect to inference FLOPs, where the optimal model size increases with the available compute budget and follows a power-law relationship.

Hover a point on the chart above to see how image quality changes with test-time compute. IR = ImageReward score (higher is better).

Performance of search across different model sizes. We study test-time scaling with different FlexTok AR sizes. (Left): We use GenEval with Best of N search and estimate the corresponding inference FLOPS. (Right): Extracting the model size with best performance within equally log spaced FLOPs buckets, we find alignment with a power law relationship. Fitting a power law of the form y=a × xb for the optimal model size as a function of inference compute, we find a=4.5×10³ and b=0.44.

Training-free Image Control

Beyond scaling, search over 1D ordered tokens also enables zero-shot control. We test text-to-image generation with concept preservation from a reference image, using DreamSim as the verifier.

For FlexTok, search gives large gains in concept similarity (+18% DINO-I, +8% CLIP-I) while keeping prompt alignment stable.

We also evaluate Janus as a comparison. To enable image-guided control for Janus, we employ a lookahead search. While Janus also benefits from search-based guidance, the improvements are substantially smaller.

Image generation with zero-shot concept preservation via search.

Image generation with zero-shot concept preservation via search. Search over 1D ordered tokens enables multimodal control without finetuning by incorporating an image similarity verifier (DreamSim) at inference time. The top row shows direct autoregressive generation with FlexTok, while the bottom row shows generations guided by image-based verification.

MethodDINO-ICLIP-ICLIP-T
FlexTok32.568.134.1
FlexTok + Beam Search 50.9 (+18.4) 76.5 (+8.4) 33.1
Janus34.869.035.5
Janus + Lookahead Search 40.7 (+5.9) 71.9 (+2.9) 35.6

Systematic Study on Verifier Choice

We study how test-time scaling behaves under different verifiers. All experiments use FlexTok with beam search on GenEval, evaluating eight verifiers plus an ensemble that averages them.

Across all metrics, search with any verifier consistently improves over the no-search baseline, showing that test-time search robustly improves generation quality. As expected, each verifier performs best on the metric it optimizes. The ensemble verifier typically ranks second on individual metrics but achieves the best overall average ranking, indicating balanced performance across evaluation criteria. Among individual verifiers, ImageReward and HPSv2 achieve the strongest average performance, suggesting that human-preference models are effective general-purpose verifiers.

Category-level GenEval results can be viewed by switching the display.

Result

Click ▶ to animate all verifiers, hover or click a single image to animate that verifier alone. Hover a row in the table below to highlight the corresponding verifier.

Comparison of different verifiers. Each row reports search using one verifier. All methods use the same beam search algorithm on FlexTok. The best score in each column is highlighted in bold. The superscript in each cell represents the rank within that column's metric, and the last column reports the average of these column-wise ranks, providing an overall rank for each verifier.

Impact of AR Prior Strengths

As discussed in the Generation-by-Search section, direct beam search over FlexTok tokens can already produce reasonable images. Here, we quantify how the strength of the AR prior affects search performance.

We compare three prior settings: a conditional AR prior (the standard text-conditioned FlexTok model), an unconditional AR prior (the same model without text conditioning), and a uniform prior. Evaluation uses 180 GenEval prompts covering single-object and two-object categories.

Uniform Prior
Uniform prior candidates
Unconditional AR Prior
Unconditional AR prior candidates
Conditional AR Prior
Conditional AR prior candidates
Step 1 / 32

Click ▶ or hover over an image to see the search process step by step across all three priors.

Visual comparison of three different priors for search. Pure search is possible, but a stronger AR prior narrows the search space and improves generation efficiency.

PriorSearchSingle ObjectTwo Object
Uniform Prioryes79%32%
Unconditional ARyes85%33%
Conditional ARyes100%81%
Conditional ARno97%48%

As shown in the figures and table above, even with a uniform prior, search reaches 79% accuracy on single-object and 32% on two-object prompts, showing that generation without an AR prior is feasible. Adding an unconditional AR prior further improves results, while the conditional AR prior achieves the best performance (81%). For comparison, the AR model without search reaches only 48% accuracy on two-object prompts.

Conclusion

Key idea: Coarse-to-fine ordered tokens are more amenable to search.

This is because early tokens capture high-level structure while later tokens refine details. As a result, intermediate decoding steps become informative about the final image, allowing search algorithms to evaluate and prune candidates more effectively.

This enables:

  • Training-free image generation via direct search over the token space
  • Improved test-time scaling, where additional inference compute more effectively improves results

Our experiments show that:

  • Ordered tokens scale better with additional test-time compute than 2D grid tokens in controlled settings.
  • Smaller models with more test-time compute can approach the performance of larger models.
  • Verifiers can steer generation, enabling flexible control (or even training-free image-level control).
  • Uniform and unconditional priors + search can still produce reasonable images, while conditional AR priors + search yield the highest-quality results.

Takeaway: Future research in tokenization and generative modeling should go beyond evaluating generation quality at a fixed inference budget and instead consider how models scale with additional test-time compute.

Limitations & Future Work

1. Search and Verification

Our work primarily uses search as a diagnostic tool, rather than proposing new search algorithms. Future work could design search strategies that better exploit ordered token structures. Developing stronger verifiers, especially those aligned with human preferences and capable of providing localized feedback, could further improve search performance.

2. Improving Ordered Tokenizers

Our experiments focus on a 1D ordered tokenizer with a flow-based detokenizer, which requires multiple denoising steps. Future work could explore:

  • one-step detokenization for faster generation
  • adaptive denoising during search
  • alternative token orderings that are more search-friendly
3. Generalization Across Models and Domains

Our experiments focus on FlexTok, currently the only ordered-token autoregressive model supporting text-to-image generation. Evaluating additional ordered-token models will help verify the generality of our findings. It would also be interesting to investigate whether similar benefits extend beyond images to text, video, or other modalities.

4. Alternative Ordered Generation Paradigms

Finally, it would be interesting to compare ordered-token autoregressive models with alternative frameworks such as MaskGIT or diffusion models, where tokens correspond to fixed spatial locations and generation proceeds through iterative refinement rather than strict autoregressive ordering.


BibTeX

@article{soto,
  title={(1D) Ordered Tokens Enable Efficient Test-Time Search},
  author={Zhitong Gao and Parham Rezaei and Ali Cy and Mingqiao Ye and Nata\v{s}a Jovanovi\'{c} and
          Jesse Allardice and Afshin Dehghan and Amir Zamir and Roman Bachmann and
          O\u{g}uzhan Fatih Kar},
  journal={arXiv 2026},
  year={2026}
}

Acknowledgements

We thank Ali Garjani and Jiachen Lu for constructive discussions and assistance in preparing the manuscript. We are also grateful to Muhammad Uzair Khattak, Mingfei Gao, and Anders Boesen Lindbo Larsen for their valuable feedback on earlier versions of the manuscript. We further thank Yizhou Xu and Zhekai Jiang for helpful discussions on the theoretical aspects of this work.